Table of Contents
Introduction: From Blind Spots to Full Visibility
It can feel like piloting a jet through thick fog when you run IT operations these days. The systems seem to be working OK, yet they can suddenly slow down, run out of storage, or go down without notice. When users raise problems, it’s too late the damage is already done, productivity is down, SLAs are broken, and IT teams are scrambling to find answers.
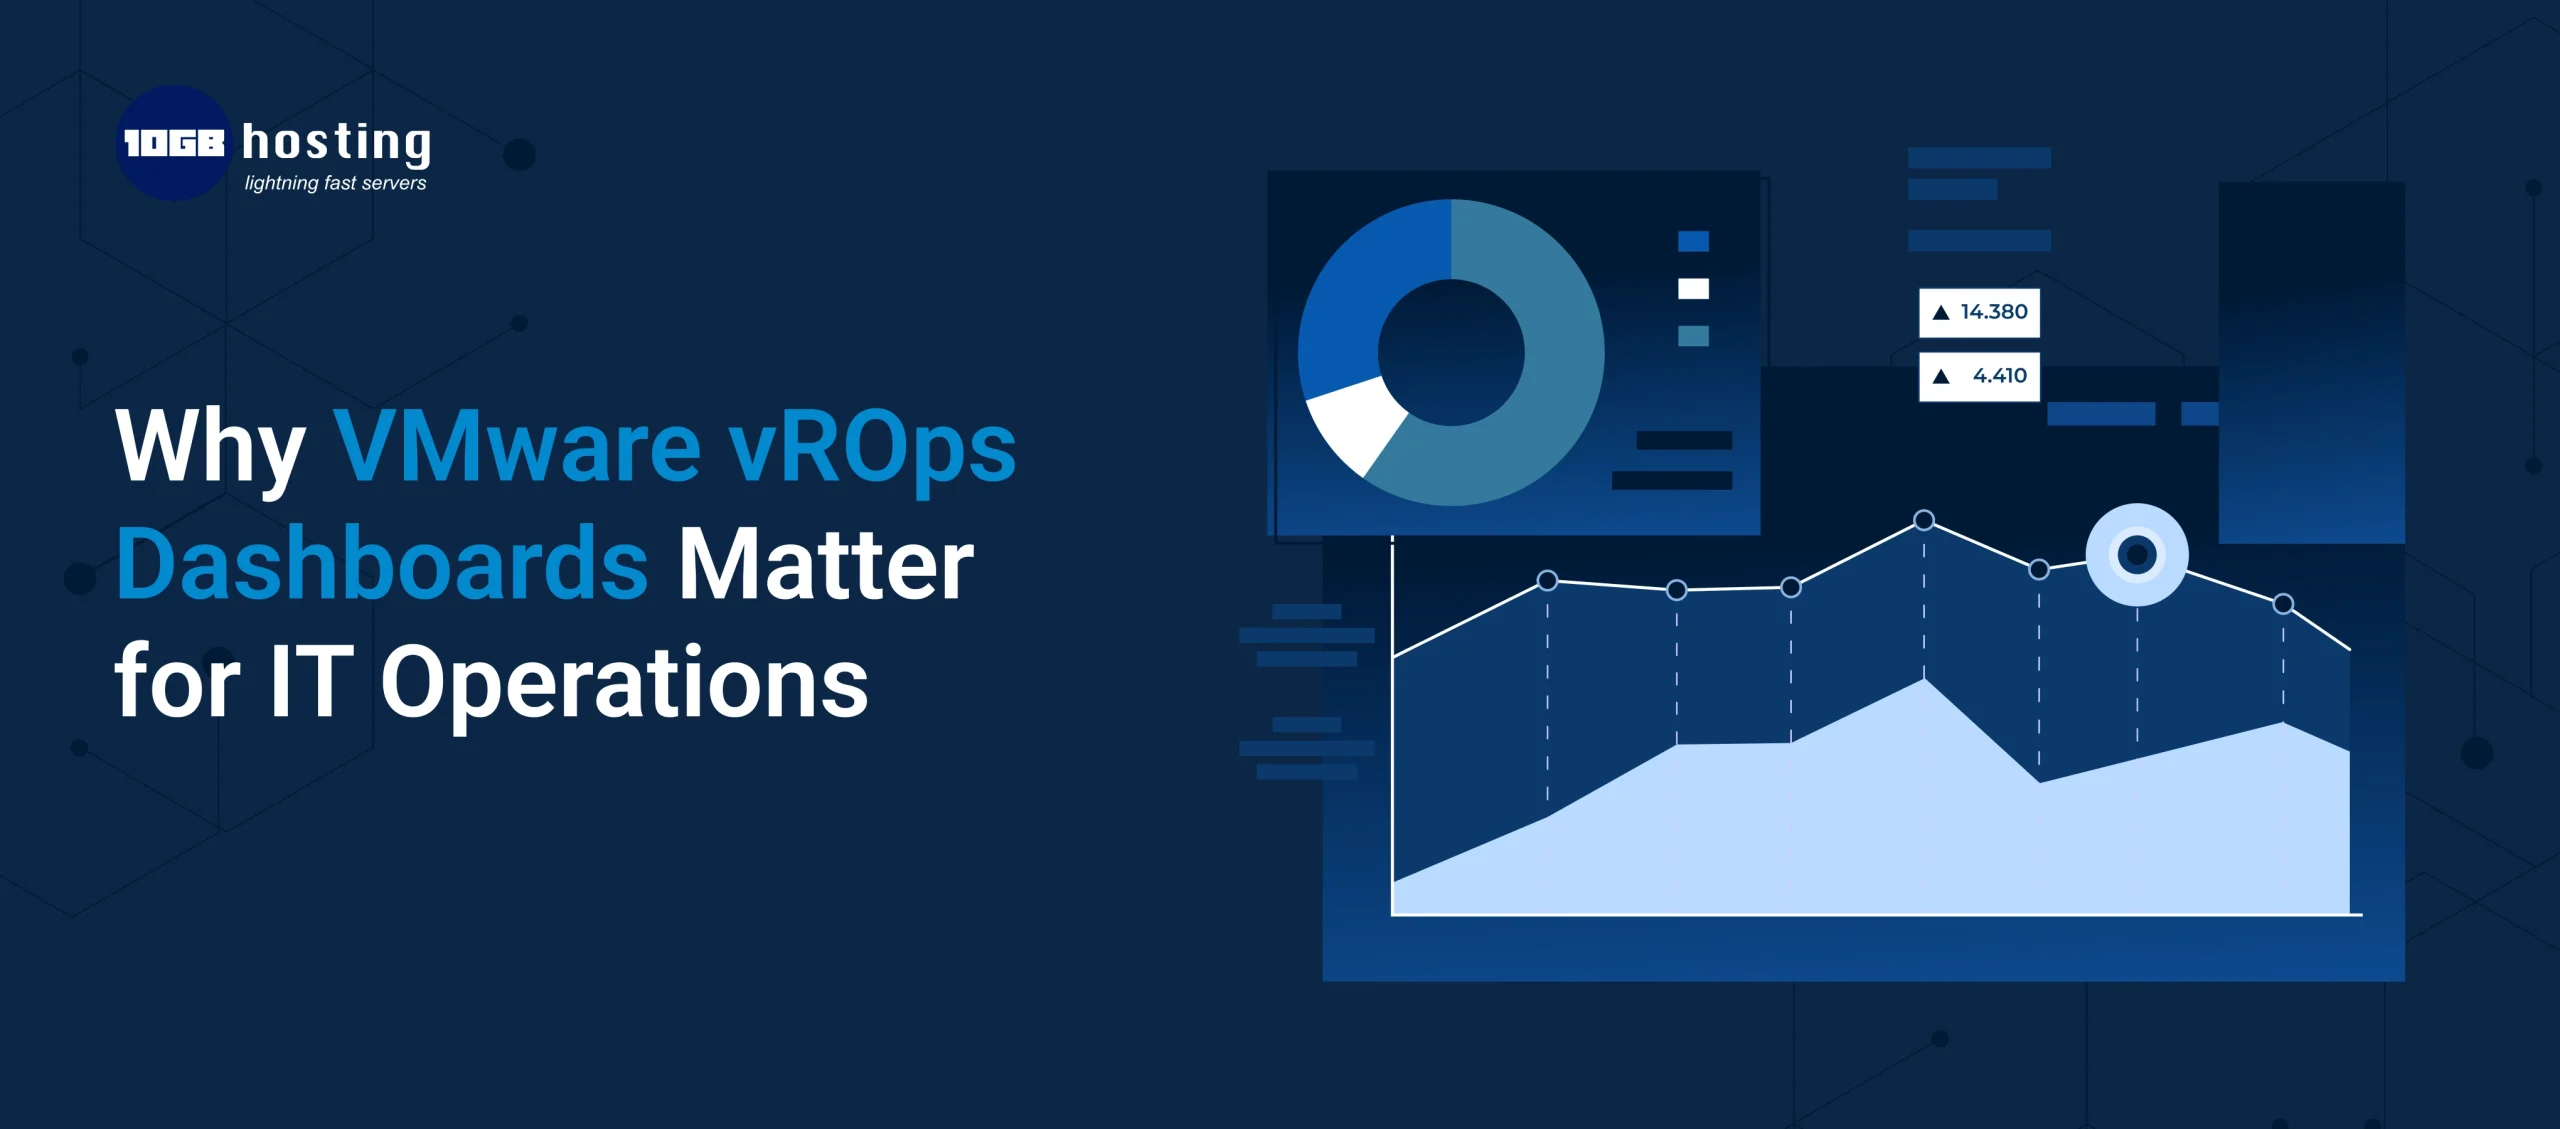
This is why VMware vROps dashboards are so critical for IT operations today. They don’t just display you facts; they tell you a story about your infrastructure. A story that shows what’s good, what’s bad, and what has to be fixed before things get worse.
We’ll talk about what VMware vROps dashboards are, how they function, and why they are so important for virtualisation and cloud monitoring in this blog. This tutorial will show you how dashboards can change the way you run your IT, whether you run a tiny virtual environment or a big hybrid cloud.
What is vRealize Operations (vROps) from VMware?
VMware vRealize Operations (vROps) is a powerful platform for managing operations that keeps an eye on and improves virtualised, on-premises, and cloud environments. It employs smart algorithms and analytics to
- keep an eye on performance,
- capacity, and
- configuration data all the time.
For businesses that use VMware infrastructure, vROps VMware for virtualisation is a central intelligence layer that keeps systems running smoothly, stably, and with room to grow.
What Are VMware vROps Dashboards, Exactly?
VMware vROps dashboards are visual interfaces that can be changed to show infrastructure data in a clear and useful way. Dashboards use widgets like graphs, heatmaps, tables, and status indicators to show you information at a glance instead of just raw numbers and endless notifications.
Dashboards can help you answer questions like:
- Is my environment healthy at the moment?
- Where do risks to performance come from?
- How much space do I have left?
- What workloads need to be improved?
In sum, dashboards make things that are hard to understand easier to understand.
Why regular monitoring isn’t enough anymore
A lot of IT teams still use monitoring solutions that are broken up and only look at certain KPIs. These technologies provide you data, but they don’t always give you context.
- Problems with Traditional Monitoring
- Too many warnings with not enough order
- There is no relationship between computation, storage, and network.
- Fixing problems after they happen instead of stopping them from happening
- Not much information on future capacity needs
This is where VMware vROps dashboards really shine. They bring together data from different layers and explain how metrics are related, which helps IT teams understand not just what is occurring but also why.
What VMware vROps Dashboards Are Really Worth
1. A Single Pane of Glass for IT Operations
Centralised visibility is one of the best things about vROps dashboards. Teams can keep an eye on their whole environment from one interface instead of having to switch between programs.
Dashboards show you:
- Hosts and virtual machines
- Data stores and clusters
- Performance of the application
- Workloads in the cloud and hybrid
With VMware vROps for cloud monitoring, businesses can see the same information in private, public, and hybrid environments.
2. Finding and fixing problems faster
When there are problems with performance, timing is very important. Dashboards use health scores, anomaly detection, and visual alerts to show unusual behaviour.
Instead of having to trace metrics by hand, vROps dashboards automatically link data from different parts, which helps teams find the root cause more quickly.
Effect:
- Less time spent fixing problems
- Less stress at work
- Restoration of service faster
3. Operations that are proactive and predictive
VMware vROps dashboards are different from typical monitoring solutions because they focus on proactive operations. Dashboards can identify future dangers by looking at past data and trends.
Some examples are:
- Timelines for capacity exhaustion
- Trends in performance decline
- Risks associated to configuration
This lets IT teams fix problems before users discover them.
4. Dashboards based on roles to help you make better choices
Everyone in IT doesn’t need the same information. You may customize vROps dashboards for different groups of people.
For example:
- System administrators: Alerts and detailed performance metrics
- Operations managers: Risk, availability, and compliance with SLAs
- Business leaders: Big-picture ideas on health and efficiency
This makes sure that everyone understands without being too much.
5. Better planning for capacity and costs
Overprovisioning is a waste of money. Not providing enough resources leads to outages. vROps dashboards help you find the correct balance.
They find:
- Virtual machines that aren’t being used or are sitting around doing nothing
- Too many tasks
- Poor use of resources
For companies who are significantly involved in virtualisation, vROps VMware for virtualisation dashboards are a must-have for getting the most out of their infrastructure spending.
How to Use VMware vROps Dashboards to Make IT Work Better: Step by Step
Step 1: Gather all infrastructure data in one place
vROps gathers data from all over the environment and displays it in dashboards that combine data from applications, storage, networks, and computing.
Step 2: Pay attention to health, risk, and efficiency
Dashboards summarise performance into useful indications instead of keeping track of
hundreds of metrics:
- Health (present state)
- Risk (threats in the future)
- Efficiency (using resources)
This makes it easier to make decisions about how to run things.
- Monitoring the health of infrastructure
- Fixing performance issues
- Forecasting capacity
- Monitoring cloud workloads
Customisation makes sure that dashboards are in line with business goals.
Step 4: Do something about smart alerts
vROps dashboards only show notifications that are important and urgent. This cuts down on alert fatigue and makes sure teams stay focused on what really counts.
Step 5: Keep making operations better and better
Dashboards show patterns over time that help teams:
- Make settings better
- Make workloads as efficient as possible
- Stop problems from happening again
- Help with long-term IT planning
Dashboards Making a Difference in Real Life
An organisation that used VMware to run business-critical apps had random slowdowns during busy times.
Challenge:
The IT staff couldn’t see clearly how resources were being used and how applications were linked to each other.
Solution:
They set up VMware vROps dashboards that showed how well VMs were doing, how much memory they were using, and how long it took for applications to respond.
Result:
The dashboards showed that memory was full because the VMs were too big. After optimization, the performance of the application became stable, and the number of operational incidents went down a lot.
VMware vROps Dashboards for Monitoring in the Cloud
As IT environments move to hybrid and cloud models, it gets tougher to keep an eye on things.
VMware vROps for cloud monitoring dashboards give you:
- Monitoring that works the same way in all environments
- Tracking performance consistency
- Information on capacity and cost
This means that dashboards are quite important for businesses who are moving to the cloud.
How to Best Use VMware vROps Dashboards
- Start using the built-in dashboards before making your own
- Don’t get too busy; focus on useful information.
- Make sure dashboards match operational goals
- Check your dashboards often to stay up to date.
- Dashboards should be a part of your everyday work routines.
Questions that are often asked (FAQs)
1. What are VMware vROps dashboards crucial for IT teams?
They give you real-time visibility, predictive insights, and faster troubleshooting, which lets IT operations be proactive.
2. Is it possible to change the look of dashboards in VMware vROps?
Yes, dashboards are quite versatile and can be changed to fit different roles and needs.
3. Can VMware vROps work in the cloud?
Yes, VMware vROps for cloud monitoring works with on-premises, hybrid, and cloud-based infrastructures.
4. How do dashboards make operations less risky?
Dashboards assist to keep outages and performance drops from happening by seeing problems and capacity threats early on.
5. Are vROps dashboards good for big environments?
Yes, for sure. They are commonly used in enterprise IT operations and scale well.
Conclusion: The Real Importance of VMware vROps Dashboards
IT teams need more than just raw data these days, when downtime is expensive and performance standards are high. They need insight. VMware vROps dashboards give you such information by turning complicated infrastructure metrics into straightforward, useful information.
Dashboards give IT teams the tools they need to work proactively, efficiently, and with confidence, from optimising virtualisation to keeping an eye on the cloud.
What to Do
It’s time to use VMware vROps dashboards if you want improved visibility, faster problem-solving, and smarter capacity planning.
Check out VMware vROps today to improve your IT operations and go from reactive management to smart operations.